
This series was created based off of a thread on the Channel 9 Site Feedback forum. Read the original post here. We heard what you wanted, so we created the first .NET Debugging Starter Kit series. Wi…
Diagnosing Application Issues - 01 [WMV] [2012/05/02]
Download PPTX slide here: Part 1 You can't troubleshoot a problem effectively until you first know what the problem is. When applications encounter stability or performance issues in the production e…
Using Perfmon to Diagnose Application Issues - 02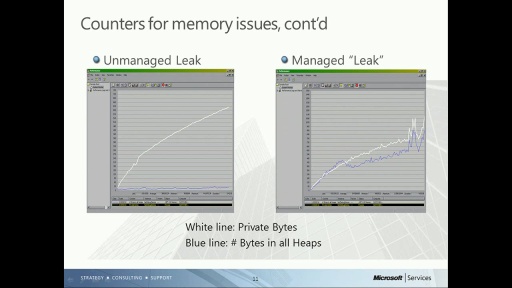 [WMV] [2012/05/02]
Download PPTX slide here: Part 2 Performance Monitor is oftentimes an overlooked tool when troubleshooting application issues. But in the production environment, it can be invaluable to helping you d…
Windbg & SOS - 03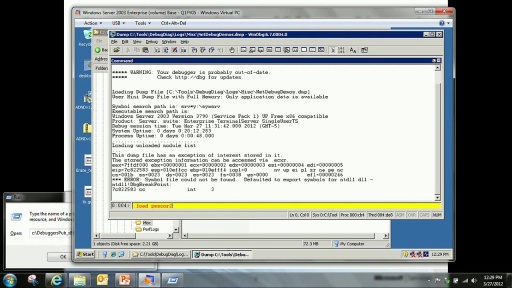 [WMV] [2012/05/02]
Download PPTX slide here: Part 3 Ever try to load SOS/psscor into your debugging session and get a "Failed to load data access dll" error? It's not uncommon, especially when you first start…
Common Debugging Commands - 04 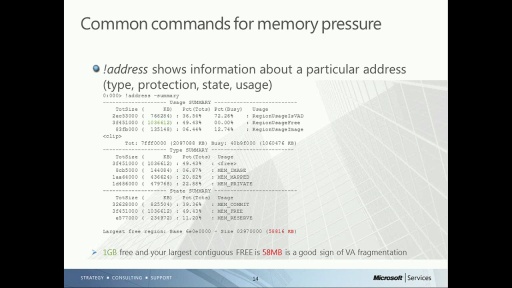 [WMV] [2012/05/02]
Download PPTX slide here: Part 4 "I got my first dump. Now where do I begin?" I get this question a lot from customers and fellow Premier Field Engineers who are learning how to debug post-…
High CPU Hangs - 05 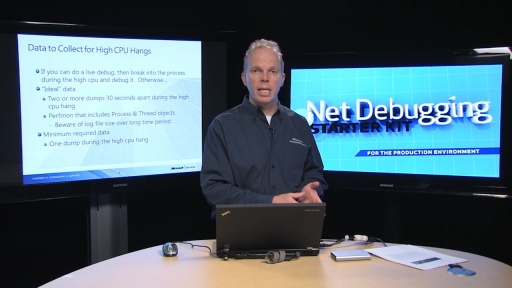 [WMV] [2012/05/02]
Download PPTX slide here: Part 5 If you've spent any time developing applications, it's likely you've encountered a high cpu hang at some point. Troubleshooting this problem in the dev environment …
Managed Exceptions - 06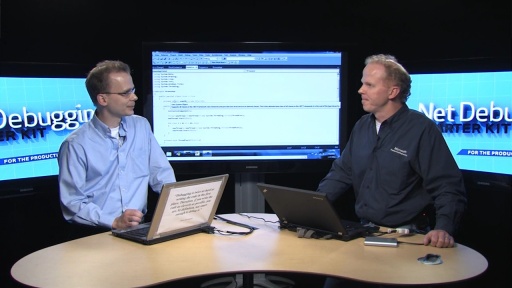 [WMV] [2012/05/02]
Download PPTX slide here: Part 6 Some exceptions don't cause your application to crash. Some do. Either way, developers should work to rid their applications of exceptions for both stability and per…
Preparing to troubleshoot memory pressure issues: a primer on virtual memory - 10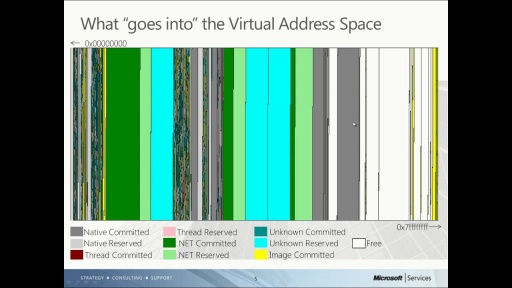 [WMV] [2012/08/28]
In Part1 of this series, we discussed how most every application issue in production can be listed in one of three buckets: exceptions, non-responsiveness, and performance issues. This last bucket in…
Analyzing a dump of a process under memory pressure - 11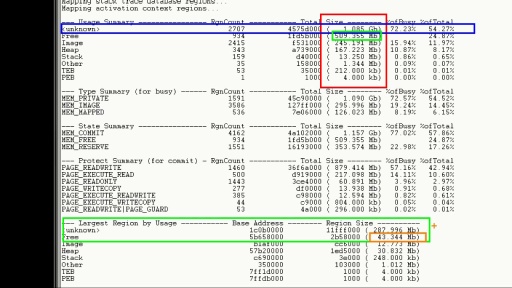 [WMV] [2012/09/06]
You may wish to watch the video using one of the high quality links on the right so the text is readable. This episode is the second of three which introduces viewers to the topic of troubleshooting m…
Putting it all together: finding root cause of high memory pressure - 12 [WMV] [2012/09/16]
You may wish to watch the video using one of the high quality links on the right so the text is readable. This episode is the last of a trio which introduces viewers to the topic of troubleshooting me…
Case Study: Debugging the Load Test - 07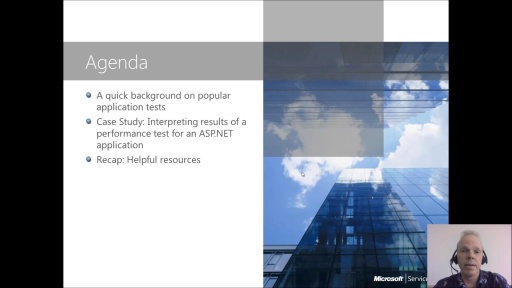 [WMV] [2012/10/08]
You may wish to watch the video using one of the high quality links on the right so the tool output in the case study is readable. Ever have a situation in which your load test isn't passing the SLA…
How to identify CLR threads in a dump - 08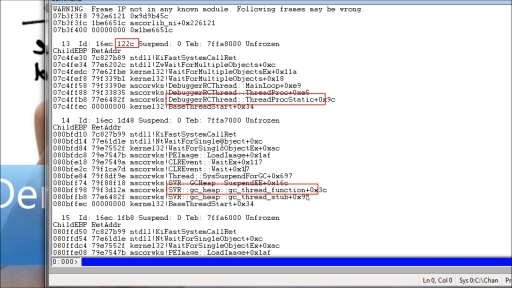 [WMV] [2012/10/16]
You may wish to watch the video using one of the high quality links on the right so the debug output is easily readable. In this episode, we'll discuss the different types of CLR threads (.e.g., GC th…
The basics of dumping out a manged object - 09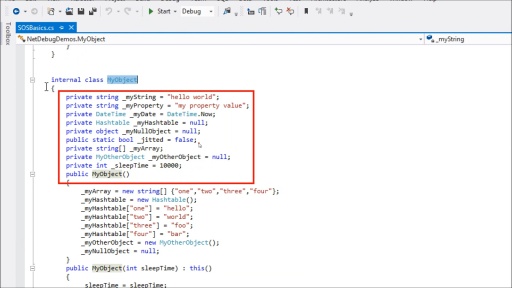 [WMV] [2012/12/05]
One of the first things you need to know in order to debug managed applications with a native debugger such as cdb, windbg, etc., is how to dump a managed object. This is a task you'll repeat often if…